

Each game has an objective and intended behavior that they are trying to shape their players into. The more the players play the game, the closer the players are moving towards the behaviour. Hence forth, indicating that your game is successful.
The Gametize Admin Console provides a wide range of analytics and reports that will help you measure and track the performance of your game. Read on to find out how you can use the different analytics available!
1. Daily Summary
 View the daily performance of your game and compare it against other day’s performance. You can see the number of players who have completed a challenge, total number of completed challenges, number of comments and votes made today respectively as seen below. Mouse over each of the box and see the comparison with a chosen date.
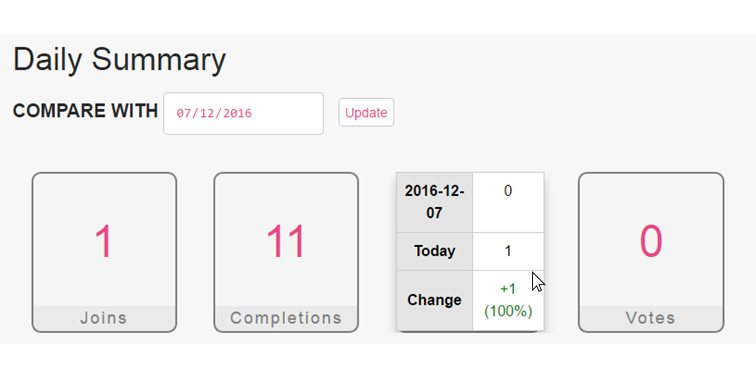
This data is presented on the first page of the Game Analytics and provide admins with an overview of the performance of the game during that day.
2. Completion Rate
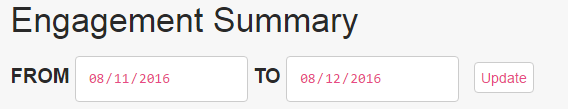
Below the Daily Summary, you can see four graphs under the Engagement Summary section. Each graph displays a different set of data across a time period that can be adjusted from the fields shown below. Take note that the data displayed on the graphs are typically more useful for games that are run over a long period of time.
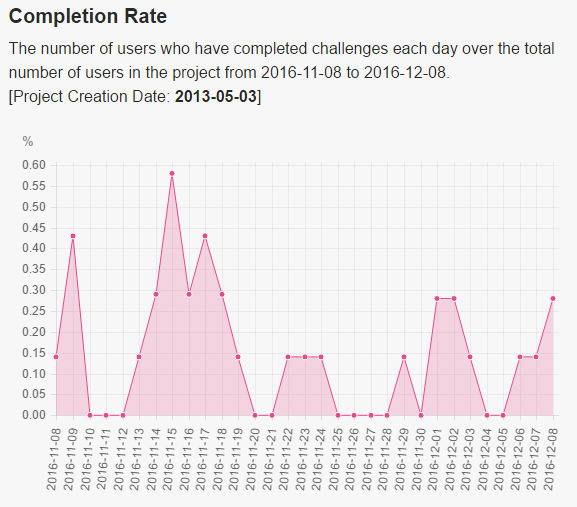
The graph of Completion Rate (see sample below) shows the number of users who have completed challenges each day compared to the total number of users in the project since the start date of the game.
This graph displays the retention rate of players: how many players come back to play the game day to day and how many did not. This figure may not be critical to all games, especially not games tied to events that are active only for a day or two. This data is more critical for long term campaigns that spans across weeks and months, aimed at getting active participation of all players.
There are also games that spans over a period of time, for educational purposes, where players complete the game and have no need to play it again. For such games, a graph similar to the one below might be expected, where few players return to the game.
3. Total User Count
The next graph displays the cumulative user count across the designated time period. This graph may be used to observe spikes in user signup, allowing the admin to observe the success of publicity efforts for the game or be prompted to investigate them.
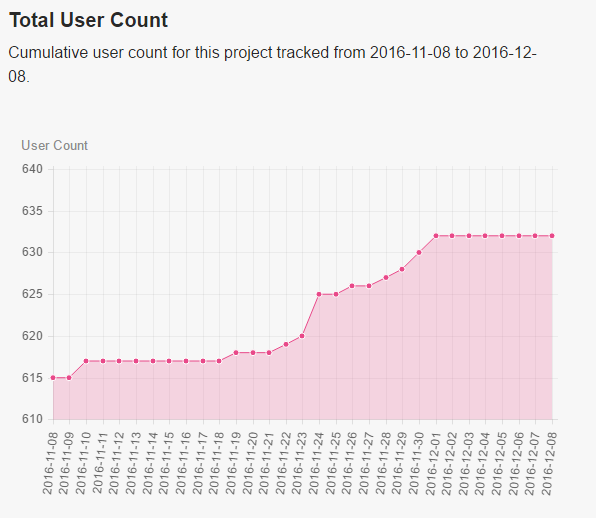
This graph will be useful for long term campaigns where the public is the target audience. You will want to see a steady increase in the number of players and stagnancy will indicate that your campaign has not been reaching out to the masses as effectively as intended.
4. Most Active Time Period
 Understand the popular time periods where your game is being played. This helps admins in understanding the best time to release new challenges and inform your players via notification. In addition, it will help you in understanding the behaviour of your players and help you in selecting the best timing to release new rewards.
TAKE NOTE: The timing is set at GMT+0 timezone. Please make the necessary adjustments for your own time zone.
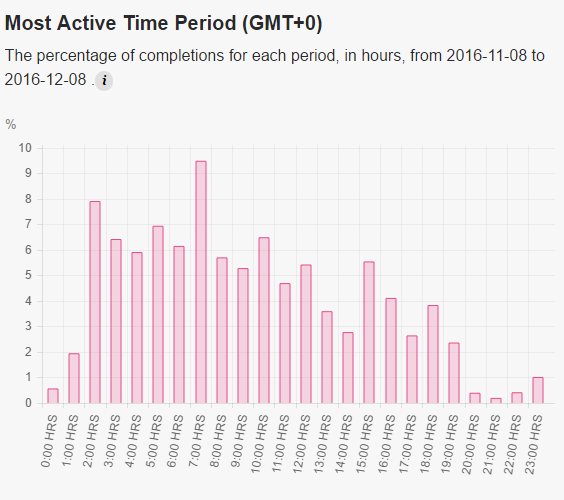
As you can see from the sample graph above, 2:00 hours to 7:00 hours (GMT+0) seems to be the timing where the game is most actively accessed. Using this as a gauge, the admin can release a limited quantity reward, catering to the higher volume of game activity by the players.
Depending on the demographics of your target audience, the most active time period may be sightly skewed due the differences in different timezone.
5. Total Completions
View the total completions made per day in the time period that was selected. Days whereby no completion was made will be omitted from the graph. The number of completions is a simple and useful indicator of the engagement rate of your game. Observe the spikes and dips in the graph when comparing across the time period. Below are two examples showing the difference between a high performing game and an average game.
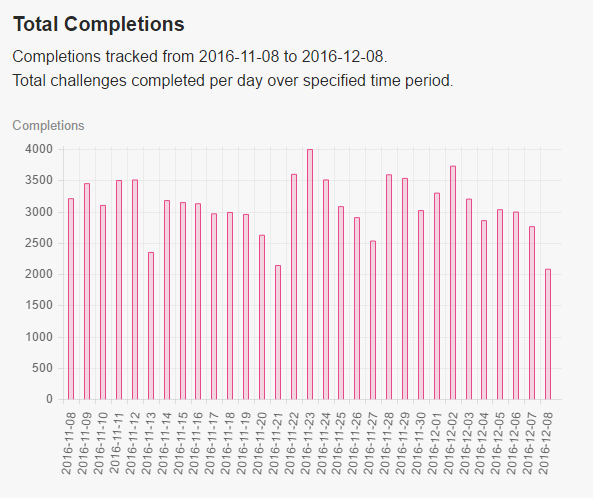
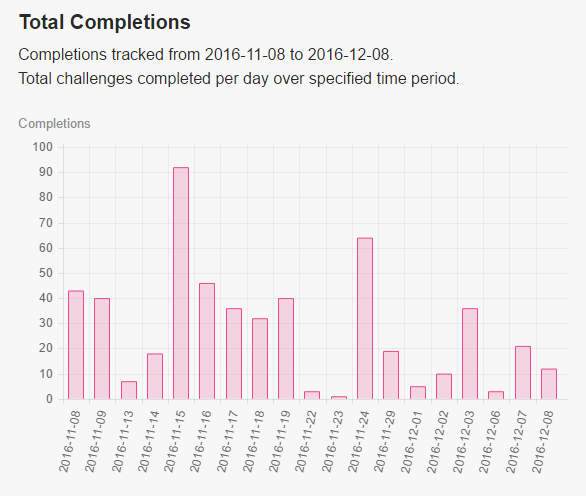
Of course, each game is different based on the objectives (which will affect the number of challenges available for completion) as well as the size of the target audience. Compare the success of your game against the performance in other days rather than comparing with other games.
Another way to understand your engagement rate with regards to completions is via the completion rate. Read more about it in the next article.
 We hope that this article has been useful for you in understanding the different analytics under engagement summary, and how they might or might not help you with understanding the performance of your game.
Continue with the second part of the Analytics Guide to understand how the other analytics can help you understand the performance of your game and players better!
If you have other ways to interpret the analytics, feel free to share with us and other admins in the comments below!